Follow us on LinkedIn
My name is Anaud Ganpaul, Head of Product Marketing at Achievers. I've been in enterprise product marketing for 25 years, and today I wanted to share some of the exciting practices that have opened up in product marketing that enable us to be more data-driven and influential in our organizations.
The themes that we'll focus on today are:
- What is the science of product marketing?
- How do we structure and measure it?
- What are the technologies we use to be more scientific? And,
- How do we communicate these results more effectively?
What is the science of product marketing?
Product marketing is a strategic function requiring creativity, collaboration, and influence. So, this often leads us to focus on software metrics for corporate-wide numbers to evaluate and measure the success of our function. Now, while the rest of the organization - from Sales, Marketing, Product, and Research and Development (R&D) - has created increasingly sophisticated metrics to measure their outcomes, product marketing often lacks the metrics and processes to demonstrate the science of our practice.
Quality and availability of data
I’ve focused on tracking profitability, market share long-term value, and all the various product-focused business metrics for a long time now. But, I started my career as a research engineer, and the issue I’ve always had when it comes to the business side of things (the business metrics, and forecasts) is not the uncertainty of the decisions that we need to make. Indeed, we thrive on uncertainty and our ability to course correct as we uncover new information.
Now, the aspect that always troubled me is the quality and availability of the data in our decision-making. But the fantastic news right now is that the tech stack in organizations today gives us the data and data signals that we need to be more scientific about the craft of product marketing. It helps us highlight the specific things that we do for an organization.
As product marketers, we know all of the domains and product marketing’s responsible for ensuring successful products. The challenge is that oftentimes we're the only ones, right? I can't tell you the number of times I've walked into a company to find my entire task list is a backlog of 10 pages of content requests with no capacity for anything else. That's not how we do product marketing.
How do we structure and measure it?
So, my team finds it helpful to start any meetings with non-product marketing teams with an overview of our product marketing framework, showing everything we do from:
- Market analysis,
- Strategy,
- Product planning,
- Pricing,
- Launch content,
- Product performance tracking, to
- Remediation.
It's a long list. But, this overview can be short, because each item that we focus on is intuitively essential for every other department. So, they immediately understand its importance.
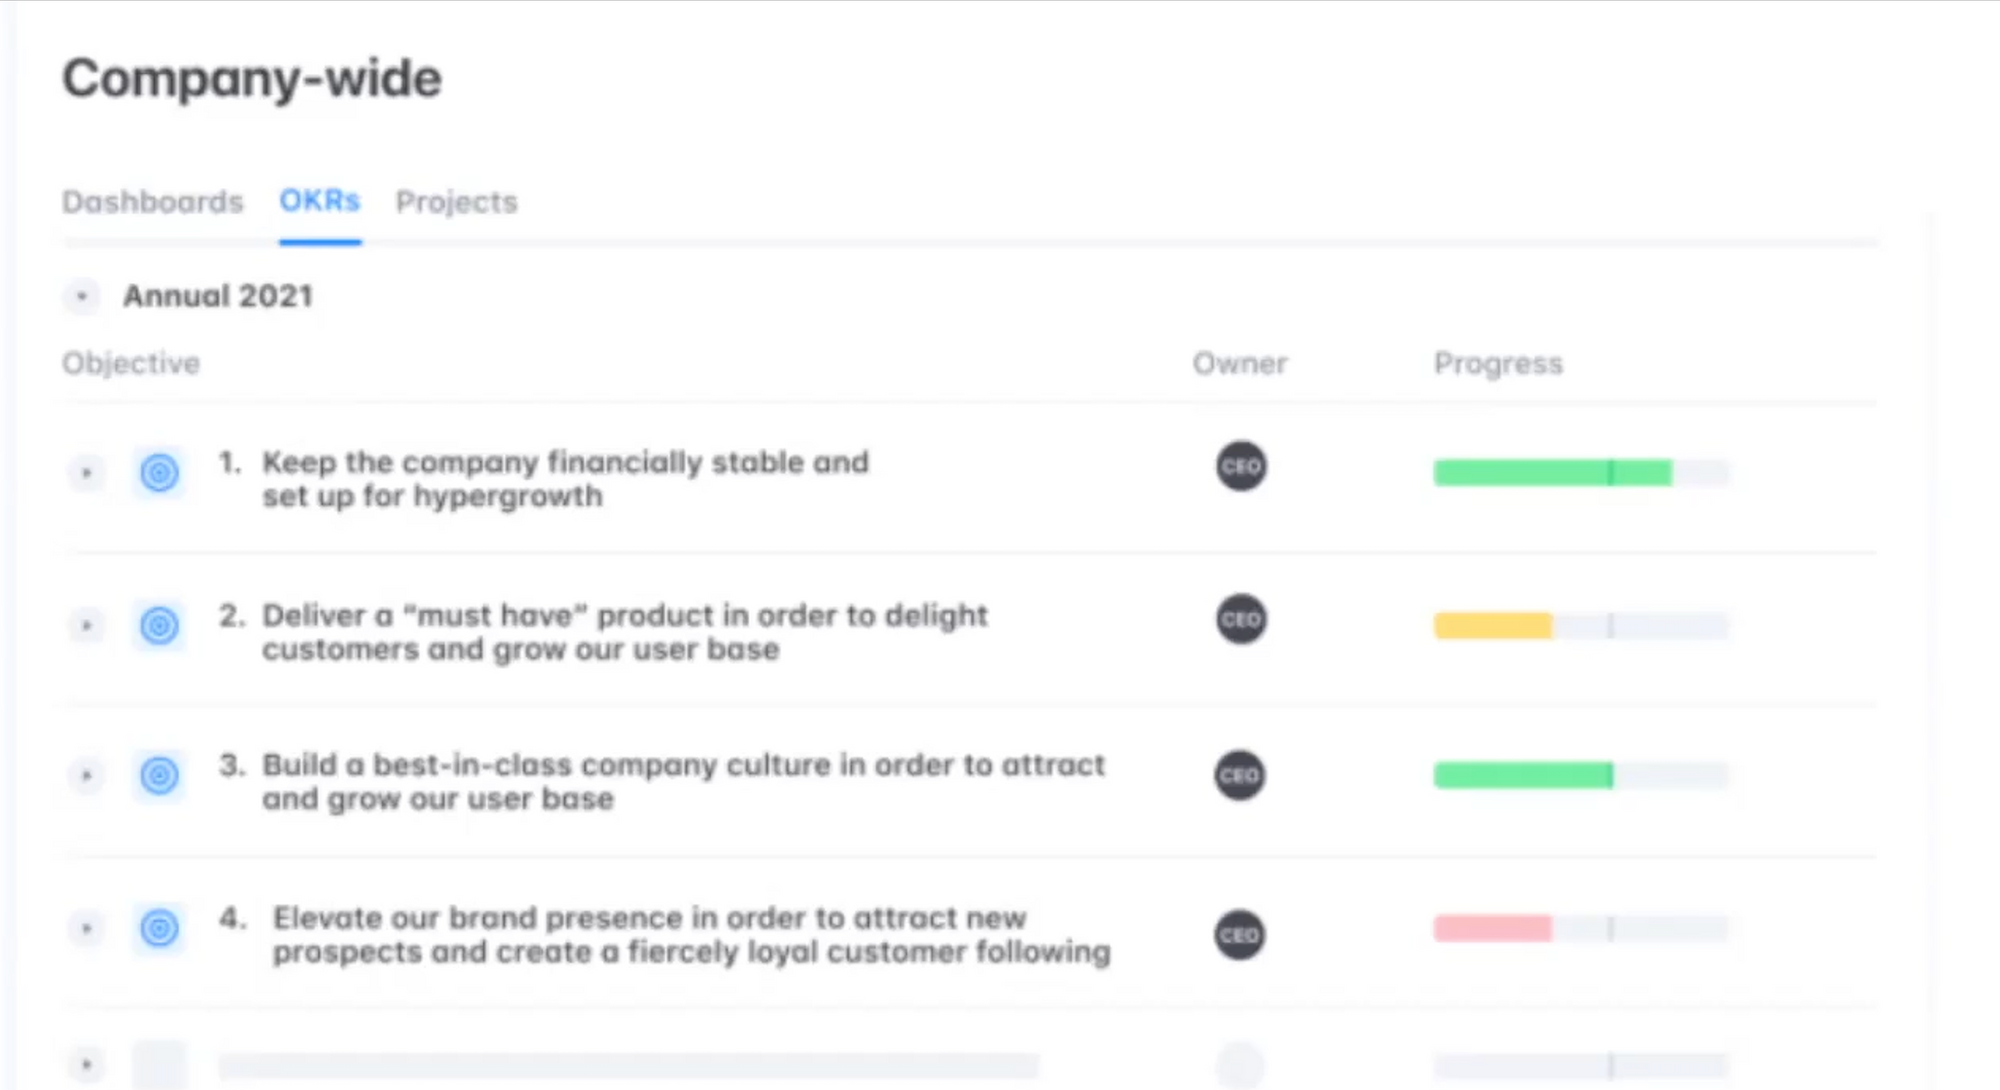
It's a great qualitative view of what we do, but we take it further by making it quantitative. And the most important tool we use for showing our quantitative impact on the organization is defining the eight OKRs and KPIs- that product marketing, and only the product marketing can know.
Historically, a lot of the product marketing metrics have been about bigger things like product revenue, product retention, and product usage. These types of high-level views are very important to the company's success and are definitely to be tracked.
But from a product marketing perspective, you have a chicken and a pig problem. If you look at a breakfast of bacon and eggs, you see that the chicken is interested, but the pig is committed. And too often these high-level metrics look like the chicken. We can slice and dice the performance data a couple of ways, but more often than not, it's other teams that hold the responsibility and are compensated for it.

For example, in a direct sales company, sales directly own the quota and revenue numbers for a company with tech support or a customer support team. They’re directly compensated for each of the customers that they keep or lose. It becomes very difficult to say that we're responsible for revenue, or retention.
So, what we do is have overall business targets as our goals to take our OKRs one level deeper. Some good ones, I found are:
Business cases: We’re directly responsible for business cases. So we put our OKRs on achieving the business cases that we set.
Competitive win-rate initiatives: We’re directly responsible for the win rate. So we can tie the increases to specific competitive actions that we run each quarter.
Content contribution to sales velocity: Sales velocity is definitely a sales skill, but we can track it to specific content pieces and the influences they have on deal velocity.
Messaging and content contribution: Messaging and change management applies to both sales velocity and win rate, and our OKRs can tie it to the frequency of the specific messaging used in the deals.
And the only way that we can have this level of granularity and show this level of influence is by building the science of our practice and utilizing technologies that are available to us.
What are the technologies we use to be more scientific?
As you know, product marketers are not very rich with a budget for technology. So, the beauty of this is that we're able to use the components already in our organization via the tech stacks of other departments- especially using marketing, sales enablement, and product teams- and use them in ways that aren't core to those teams but are extremely valuable to us. And of course, there are some components that make sense for us and in product marketing to purchase with our budget.
Product Lifecycle
I want to talk about how we build the science around our practices in the market share, targeting, competitive and win-loss, and messaging.
Market Share
I’ll start with market share because it's a logical place to start in the product life cycle discussion. Market share is one of the most important things we use to understand the market and know about our products.
It tells you- the healthier company- whether you should be growing faster or are at risk of acquisitions. Or conversely, if you're in the market, about the market leader's advantages. You want to know:
- Where you are today, and
- Where you will be at the end of a certain period.
If you have private competitors or large competitors with multiple product lines, it's difficult to calculate. This is because you can't actually see the revenue of competitive products, and try to proxy this by looking at the number of employees on LinkedIn or other sources.
But you're trying to see specifics that these proxies can miss, such as revenue per employee for the product, average deal size for the product, or if there are more deals in the market that you're missing.
So, we look at the number of deals in the market. It's one of the key metrics that we inspect. We determine the number of projected deals in a given year using market size projections that we get from multiple sources, divided by the average deal size of the market. Then we triangulate this number using other sources.
In fact, we've been able to engage our external analysts to give their models using their own market projections and their discussions with other competitors, and other companies in the space.
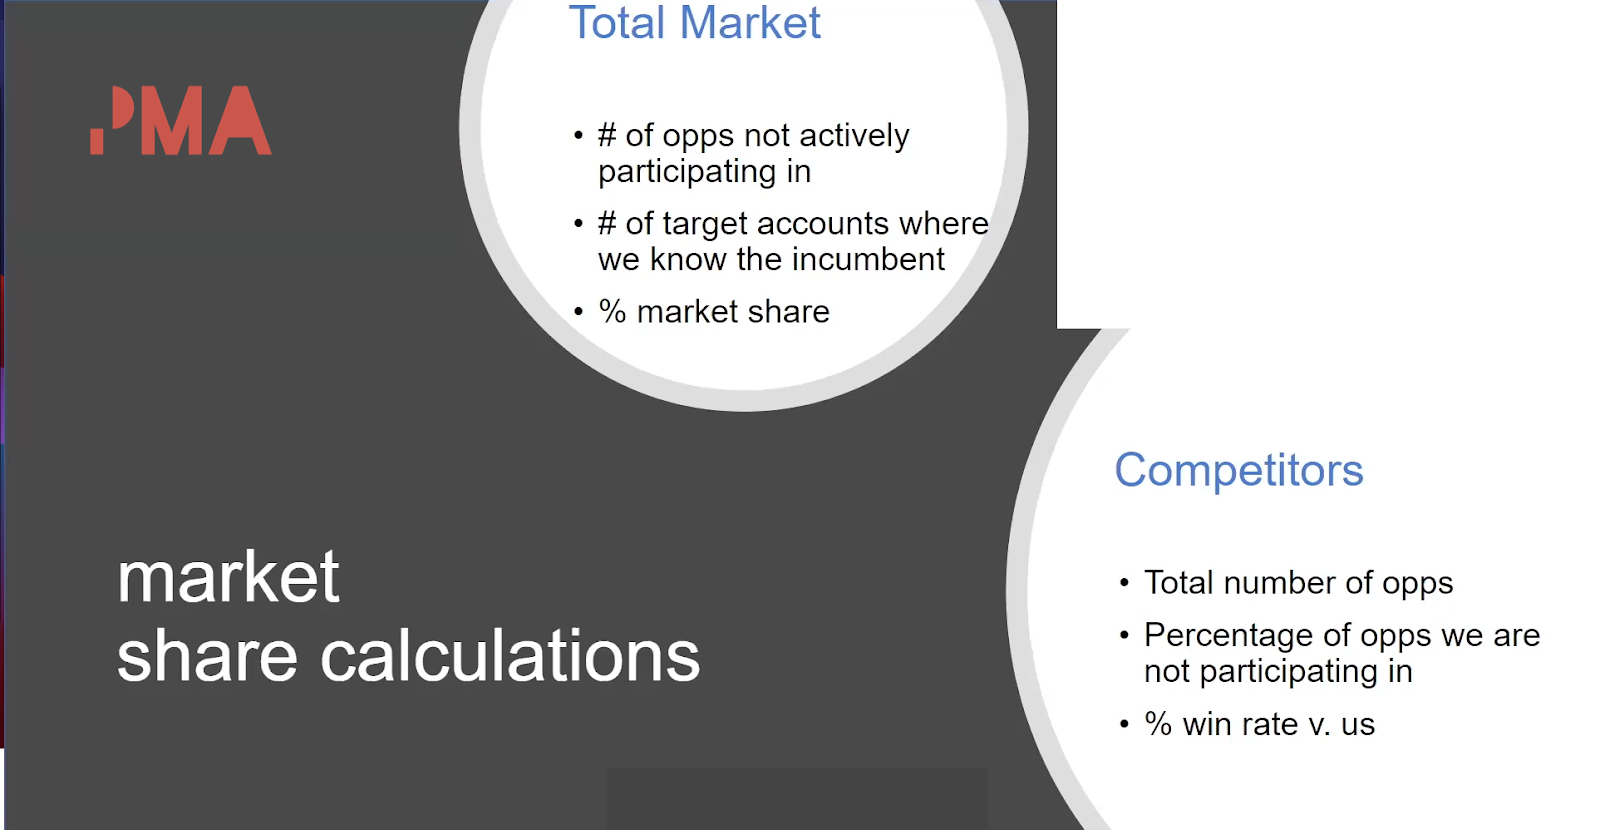
Then, we review these total numbers- the total number of market deals against the number of deals that we're engaged in to make sure that we're participating in all the deals out to tender. So we look at it in two ways:
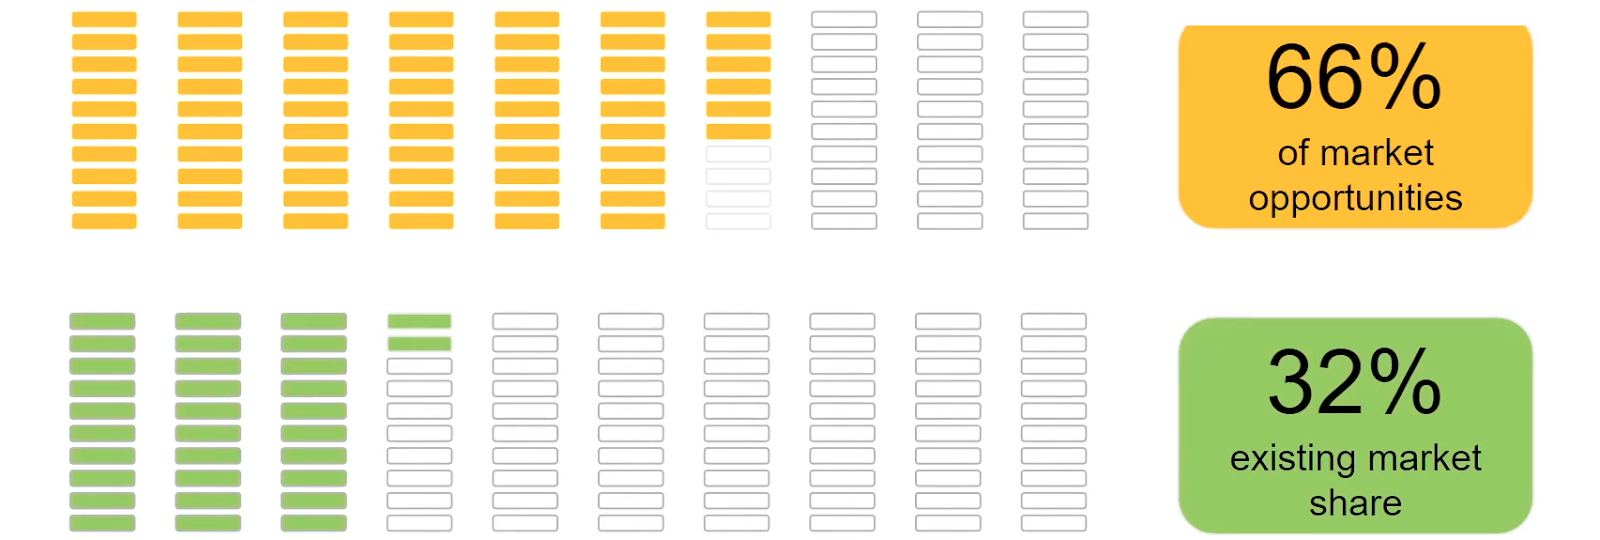
- Overall market share calculations: looking at the number of ops in the market, the total number of ops were not active in the incumbents in our target opportunities and our percent of market share overall.
- Drill down on a competitor by competitor basis: here we look at the total number of opportunities- the percentage of opportunities we're not participating in against a specific competitor and win rate percentage on a competitor by competitor basis.
The way we've been able to calculate these numbers has become increasingly sophisticated. Of course, we run a report in Salesforce or CRM system to see our competitors and opportunities. But we always find that this data is often incomplete.
And we augment that with our win or loss interviews, which we have a big focus on. We always ask “which competitors did you consider?” It's a specific question that we ask to make sure that we understand the full picture of each opportunity that we’re able to get interviews with.
Revenue intelligence tool
To broaden our understanding of the market, the most important advancement that we've had in getting more complete data is using our revenue intelligence tool and our sales enablement tech stack. These are tools like Gong, Chorus, etc to record our sales interactions and allow us to query them.
Although these tools aren't built for product marketing, they give product marketing incredible insight because they record the calls your sales teams make. So it records the effectiveness of your messaging, as well as the intelligence provided by your market prospects. I’ll talk a lot more about this.
But in this case, we run a search on all our competitors and we can see how many times our prospects are specifically bringing them up. These are typical responses to one of two questions:
- What product are you using today? Getting the metrics for this question gives us a great understanding of existing market share which industries and segment competitors are strongest in.
- Who else are you looking at? The answer to this question gives us a percentage of opportunities we're seeing competitors in with relative confidence. And we also see if new competitors are emerging in our opportunities.
There will always be prospects reluctant to tell you who they're looking at, but most buyers realize that it's in their best interest to share this information.
So, adding this type of querying and understanding of all our calls and deals has increased the quality and quantity of competitive data points in our opportunities by about 40%. Now we know about 40% more deals to have competitors and who those competitors are.
ABM tool
The other tool we use is our ABM tool. We can use this to set keywords for each major competitor. And we see which accounts in our target market are likely to be considering each competitor, including the accounts where we don't have any competitive active opportunities. Using these tools, we get a much more complete dataset and give us a much more precise view of what our actual market share is.
Targeting
The next item I'll address is how to decide on targeting and investing in your resources. One of the biggest challenges in many B2B companies is that the volume of deals is relatively low. So, the information you get from your wins and late-stage losses feels more anecdotal than actually quantitative.
To get more confidence in our data, we see that B2B companies typically have relatively large deals with earlier stage opportunities that you can query- that typically want to not look at all the ops- but only the opportunities where your BANT (budget, authority, need, and timeline) is established to make sure that the opportunities are valid.
In addition, the goldmine of targeting data on a company like ours is to use its rich historical data. Again, you won't go all the way back, you only go back to the point where you've established product-market fit. And this gives you the large data set you need to make more confident decisions.
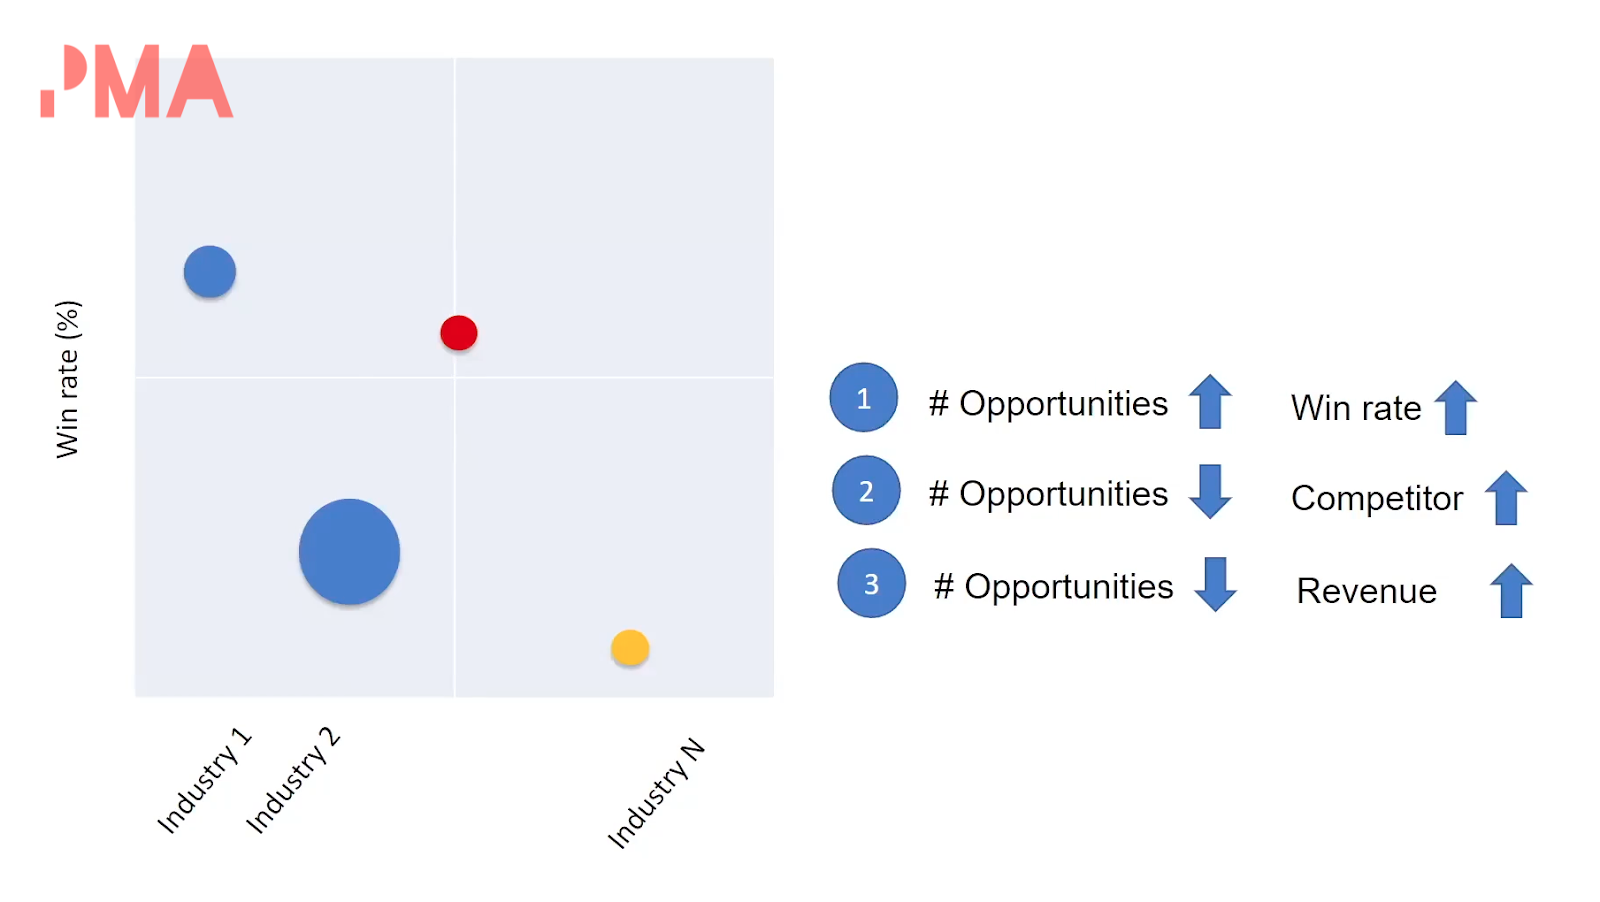
I'll share with you my favorite report that we got out of our CRM system. I use Tableau or Power BI or some sort of business intelligence app to get this view, and it has three components.
One, the number of opportunities is represented by the size of the circle to the win rate- which is on the y axis- and revenue which we represent by color.
Then reviewing this, you can now set your priorities for your business and product team. It may be counterintuitive, but I suggest first prioritizing the industry segments where you have the best win rates. We're typically looking for new opportunities with product marketing, but oftentimes, the biggest wins are playing to your strengths.
By focusing on these high-performing industries with high win rates. You can formalize your messaging of business pains to support your new hires who don't have this institutional knowledge. You can refine your segmentation and tweak your messaging to be more successful in the subsets within this industry where you're less successful.
And, you can target your main generation to address these specific industries and increase the number of opportunities. You can establish a dominant presence in the industry, making it even easier to win these deals.
The win rate is high in these segments, so your revenue line will see a more immediate increase for your efforts.
The other priorities are the verticals with high numbers of opportunities, but low win rates. These are people who have real needs for your products. And you're already generating leads, which is 80% of the battle. But most likely, you require enhancements to your product and services to be competitive. These are longer lead times. But if you get it right, they're very attractive.
Next are the verticals where you have a low number of opportunities, but that you know competitors are strong in and it's something that you're missing. I want to start to address these opportunities so you can stem the flow of easy revenue going to your competition. But, these will require a lot of creativity across multiple departments to generate opportunities, get references, and increase your win rate. Again- longer lead time.
And finally the verticals with a low number of opportunities for high revenue dollars. Now, these are typical with types of opportunities and deals and they typically need specific deal-by-deal support, customized for every opportunity.
Competitive and win/loss
Now, I've made a lot of references to competitive and win-loss. And the reason I do so is that it’s one of the most direct access we have as product marketers to primary market data. We tend to speak to about 80% of our wins and 30% of our losses in our company and we can ask them very targeted questions about the business rationale, technology, and evaluation of the teams that they've interacted with. We find this to be a critical source of data.
Although we do outsource for win-loss interviews for less strategic channels, we conduct the majority of them in-house. The feedback resonates more and more, and action is taken much more quickly when senior leadership’s on the win-loss calls. We also have two components in our tech stack for competitive and win-loss competitive technology vendors and again, our revenue intelligence app.
Some of the technology advancements we've made with competitive and win-loss are that we invest in a competitive vendor, one such as Klue or Crayon, to keep up with the volume of new competitors that are emerging, especially in our mid-market or high volume channels.
We actively research and update our battle cards for the top five competitors. And we put most of our focus on that. But given our resource constraints, we use competitive technology platforms to help us curate and keep up to date on a large number of infrequent competitors in our high volume channels.
Revenue intelligence
Next, the most meaningful technology contribution to our competitive and win-loss has, again, been the use of a revenue intelligence product. Of course, we read the notes in our CRM to prepare for interviews. But by using our revenue intelligence tool to query each and every meeting in these opportunities, we can listen to exactly what was presented to the prospect and how they responded.
This allows us to surgically prepare for each and every win-loss interview. And to test our hypothesis of what would resonate, or how we should position or objection handle to increase win rate. I'll give you an example of how this works for us. At one point last year, we were starting to notice an increased loss rate to a specific competitor in our opportunities.
So, we focused on scheduling win-loss interviews with these competitors. In our first loss, our prospects told us that a specific important product feature was not as good as our competitors. This actually surprised us. So, we went back and reviewed our clock tracks, demos, and our revenue intelligence tool. And we found that we didn't even mention the fact that we have this feature.
So, we put out an alert informing the sales team to always position our capabilities when going up against this competitor. We rapidly got another loss interview with the same competitor. And the same loss reason was given with the same feature.
We reviewed the sales meetings with our revenue intelligence tool and found that our sales team actually did position the solution properly, in accordance with our alert. This really surprised us because we thought we had an equivalent feature. So now during our next win-loss interview, we drilled down into the prospects’ needs, the specifics of the feature, and what they were looking for.
To our surprise, there were some new innovations that we were lacking. Armed with this new knowledge, we were able to create the objection handling, product roadmap requirements, and test out in later stage opportunities against the same competitor.
We did win these opportunities, and it was validated in win-loss interviews, so we rolled out this new messaging across the company. Then, we were able to track the success by showing across all of our deals, we completed this rapid test and learn cycle in three attempts.
We went from losing most opportunities to this competitor to winning most deals in the span of a month, a cycle that would traditionally take us at least a couple of quarters. And we can see by our revenue intelligence tool - to prove the effectiveness of it- that the number of times our prospects brought up this feature had gone down because our competitors stopped protecting this objection for them, as they saw that it was no longer effective for them in their opportunities.
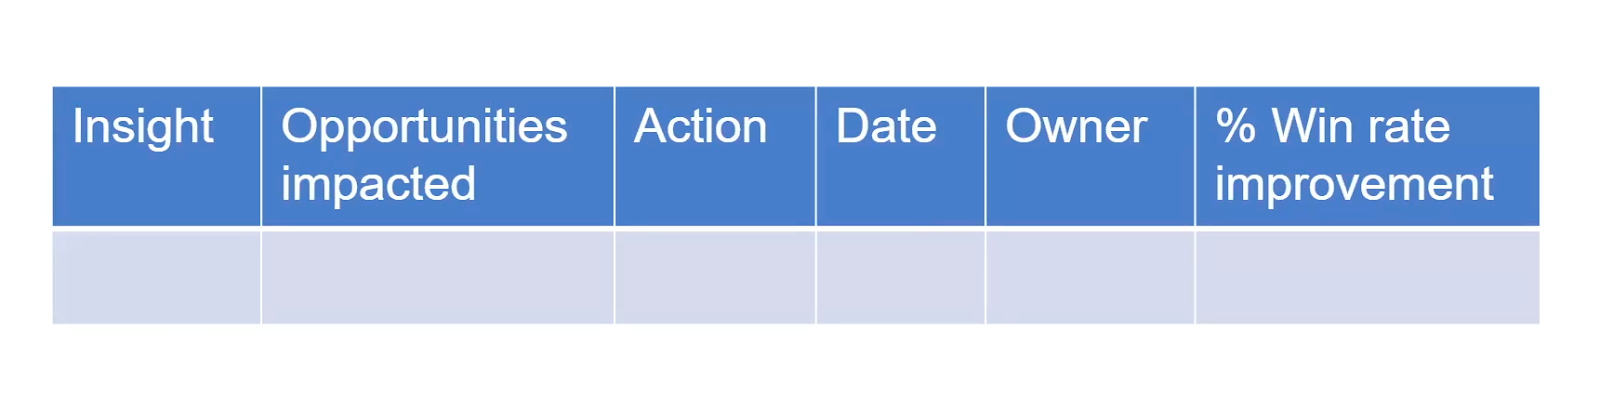
And as we do actions like this, we present these findings, actions, and our impact to the different departments across our company and to our executives on a regular basis.
Messaging impact
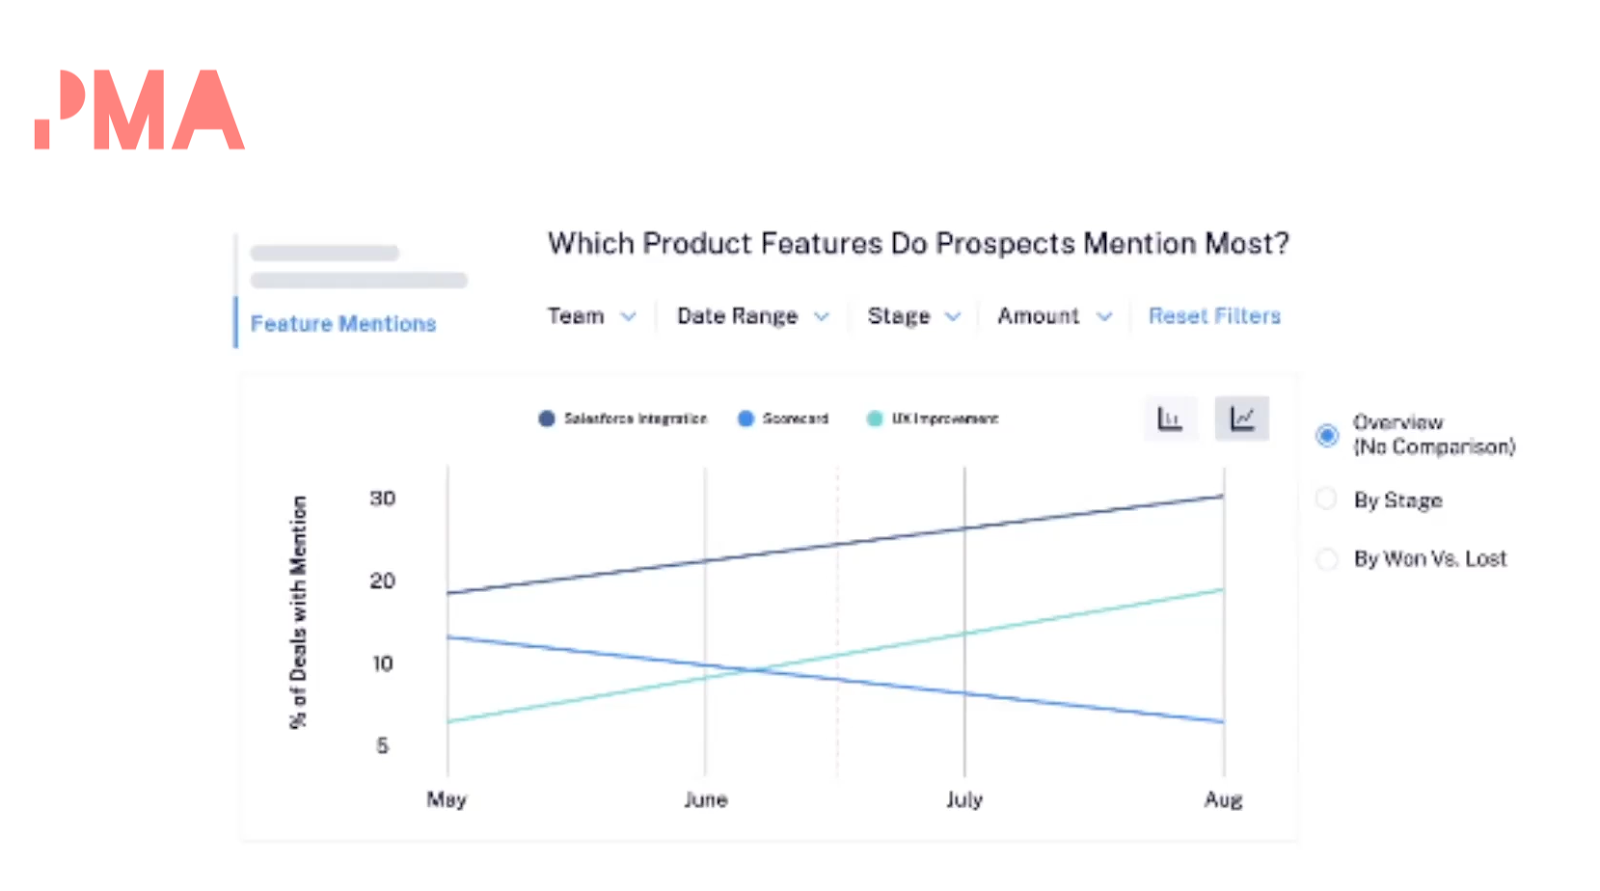
This is very related to my next topic on positioning, messaging, and collateral. When we roll out new messaging with a launch new competitive initiative, we can track the frequency of search phrases that are being used using our revenue intelligence tools. Whether it's a new positioning phrase, new objection handling phrase, or a new product offering, we can search across all our interactions that our sales team has and analyze them.
We can analyze both frequencies based on how well our training has been received and adopted, measuring success by asking, did we move the deal to the next stage? And did it result in a win? If we see that most successful deals use a specific phrase objection handling or product, we can use this data to drive adoption across the organization.
Sales content metrics
And finally, I'll circle back. I started the presentation with a backlog of content requests without rationale. Our tech stack is really helping us solve this issue as well.
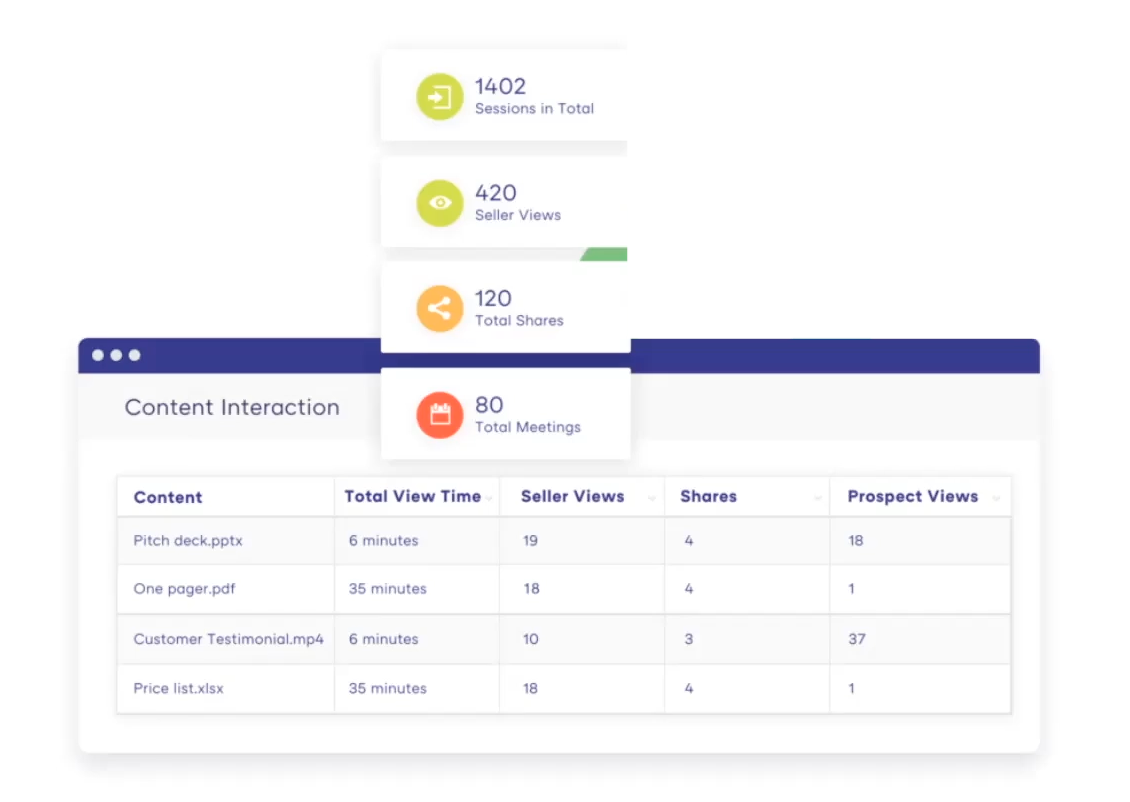
Our content management tool- like Showpad, Uberflip, or any others- lets us analyze the content shared by our sales team. It allows us to see the specific metrics on usage frequency, the percentage of opportunities to sales teams, how prospects are using this content, and how often this is used.
And we can analyze its effectiveness, which content used leads to advancements to the next stage and sales cycles, and ultimately wins. And then from our market-facing content, we use a PR media tracking app.
In our case, we use Conclusive to get the share of voice and to test how well specific messaging SoundPEATS are performing in the market overall compared to and compared to competitors. Armed with this analysis, we can reduce the sheer volume of content produced and focus only on the most effective pieces that are working in our opportunities and in the market.
So in summary, here’s the product marketing stuff tech stack that my team has put together.
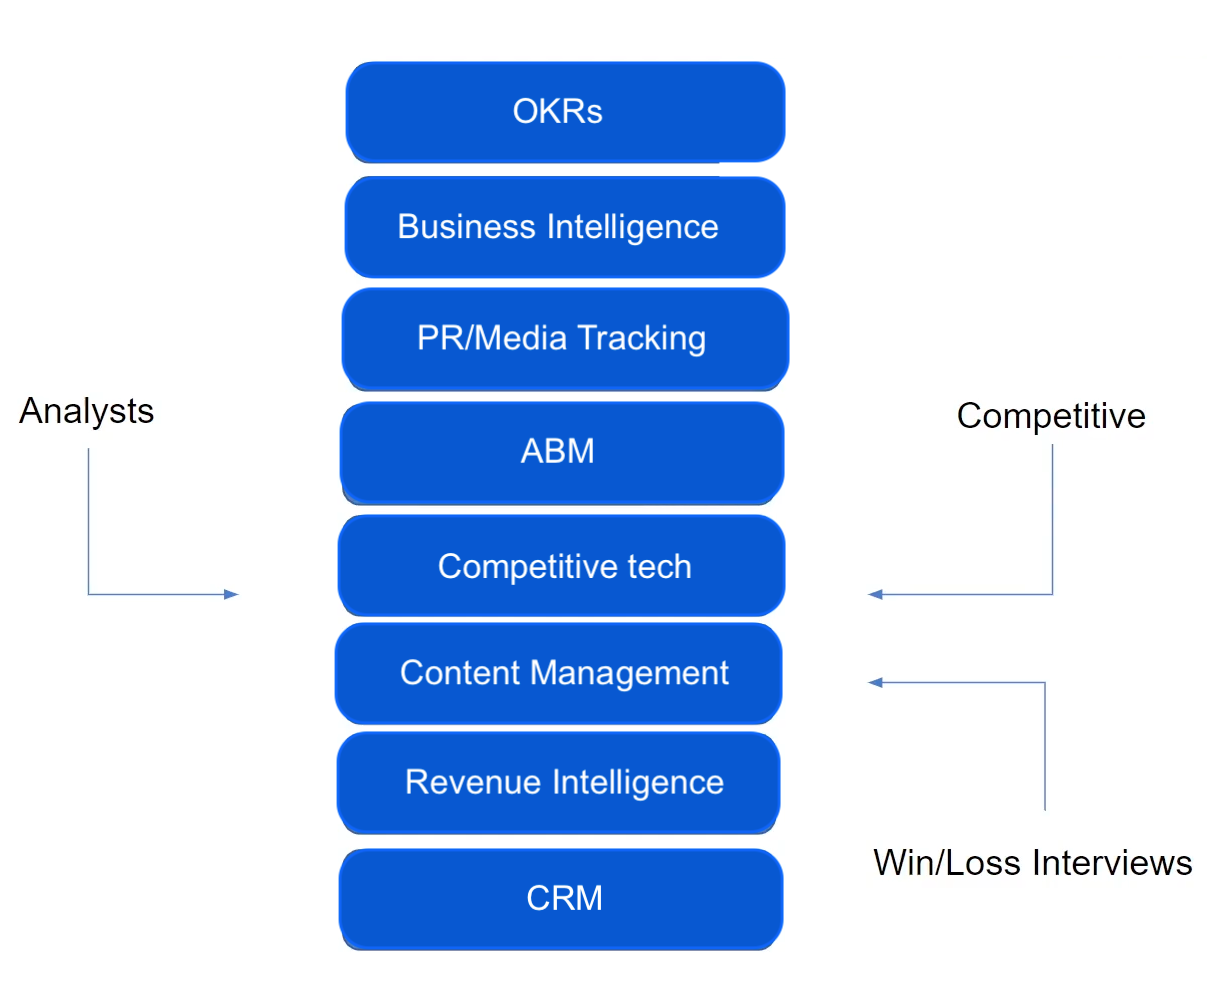
So, we have offline signals like analyst input, competitive analysis, and win-loss interviews, and we feed it into our online product marketing tech stack consisting of our CRM tool, our revenue intelligence tool of content management, competitive technology tool, ABM, PR media tracking, and then our business intelligence tool for reporting and OKRs to report our progress.
We use this integrated view of our practice to drive decisions and product marketing success based on hard data and make product marketing more scientific.
Thank you.