Follow us on LinkedIn
Jeff Hanrahan, Senior Director of Product Marketing at RealPage made this presentation at the Product Marketing Festival in June 2021. Watch presentations OnDemand now.
Based on my previous roles working as an engineer in the manufacturing industry before moving into product marketing, I’ve noticed there’s a lot of waste in PMM when looking at the org through a lean manufacturing lens.
In this article, I’ll discuss:
- 8 forms of waste in manufacturing
- Waste in product marketing
- 3 tools to gain efficiency
- The key to success
I'm going to share some tools I use to connect go-to-market strategy to execution and ensure organizational alignment.
I'm presently working as a Senior Director of Product Marketing at RealPage, where I help bring to market technology solutions for real estate owners and managers.
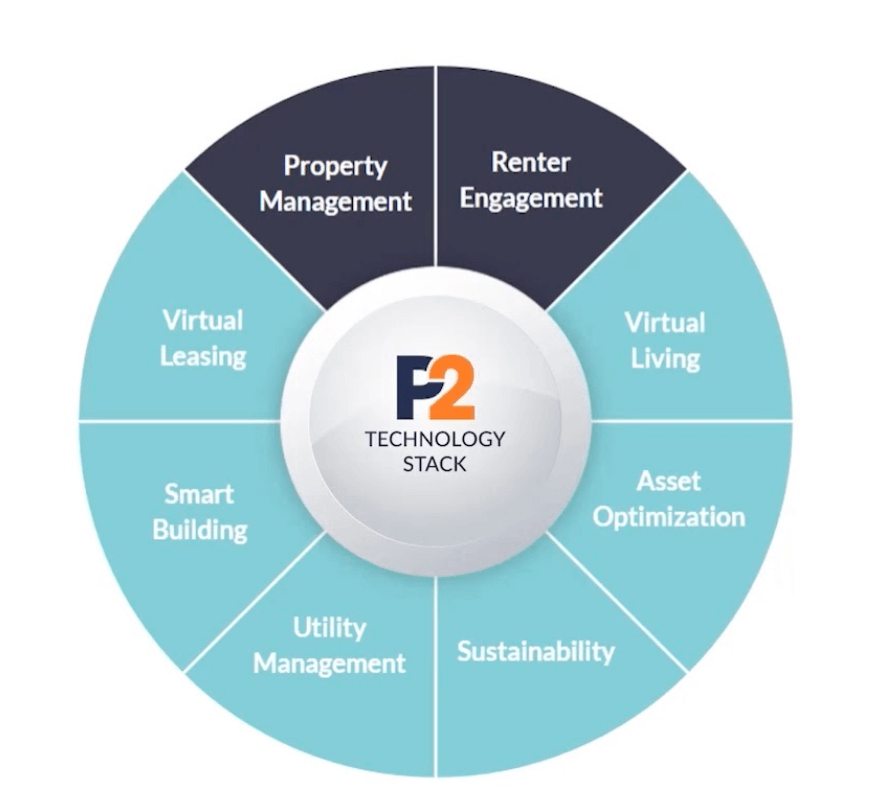
We recently launched our peak performance technology stack, which covers everything from core property management to setting up smart buildings with technology that will take residents all the way from the sidewalk to the sofa.
However, long before I worked at RealPage, or even in product marketing, I started my career as an engineer at IBM working in their semiconductor manufacturing division. What I find interesting about the manufacturing engineering role is his or her mission to maximize the profitability of the factory.
The primary way he or she does this is by eliminating any action or step in a process that does not add value to the customer, i.e. waste.
8 forms of waste in manufacturing
There are the eight forms of waste from the lean manufacturing process:
- Transport
- Inventory
- Motion
- Waiting
- Overproduction
- Over-processing
- Defects
- Skills
Looking at them, they don't seem very relevant to product marketing and you might be wondering what I'm talking about, but bear with me, because there is a link.
Waste in product marketing
When I apply my manufacturing engineering lens to look at the role of product marketing and processes within it, I see there's a lot of waste.
For example, product marketers waste so much time explaining their role and how their overall contribution within an organization.
Over-processing
For me personally, I see over-processing as a form of waste that I often fall into. Just a few weeks ago, our VP of Sales asked me to help put together a sales proposal. I got excited to build out this fancy color glossy Word document with photos and icons and stylized text when all she really wanted was help wordsmithing an email.
That's a good example of delivering a much higher quality than was required or even needed, and wasting a lot of effort.
But there are certainly many others in here that we all fall victim to from time and again.
3 tools to gain efficiency
I'd like to share how you can use three methods I learned as a manufacturing engineer to minimize these wastes and increase your efficiency by connecting go-to-market strategy to execution and ensuring organizational alignment.
In method one, I'll demonstrate how to use an X-Matrix to connect strategy to execution.
In method two, I'll show how to use a bowling chart as the framework for monthly reviews to track results and prioritize future efforts.
In method three, I'll explain how to use structure problem solving to find the root cause of missed targets and get them back on track.
Finally, at the end, I'll share the key to success I've learned from using these methods across different companies and different organizations.
Before I jump, in a few comments.
- These methods are not prescriptive, so please adapt them as appropriate for your situation. I did not invent these methods, I adapted them myself from lean manufacturing, which itself is heavily influenced by the Toyota Production System, which came out of Deming’s process for manufacturing.
- These are the best methods I know of, I'm always looking for a better process so if you have one, please let me know, I'd love to chat.
1. The X-Matrix
Otherwise known as the hoshin kanri method, the X-Matrix is a lean management planning method that connects strategy to actions.
The product, when it's filled out, is a set of well-defined goals with clear owners and targets that can be checked monthly using the bowling chart that we'll talk about in the next section.
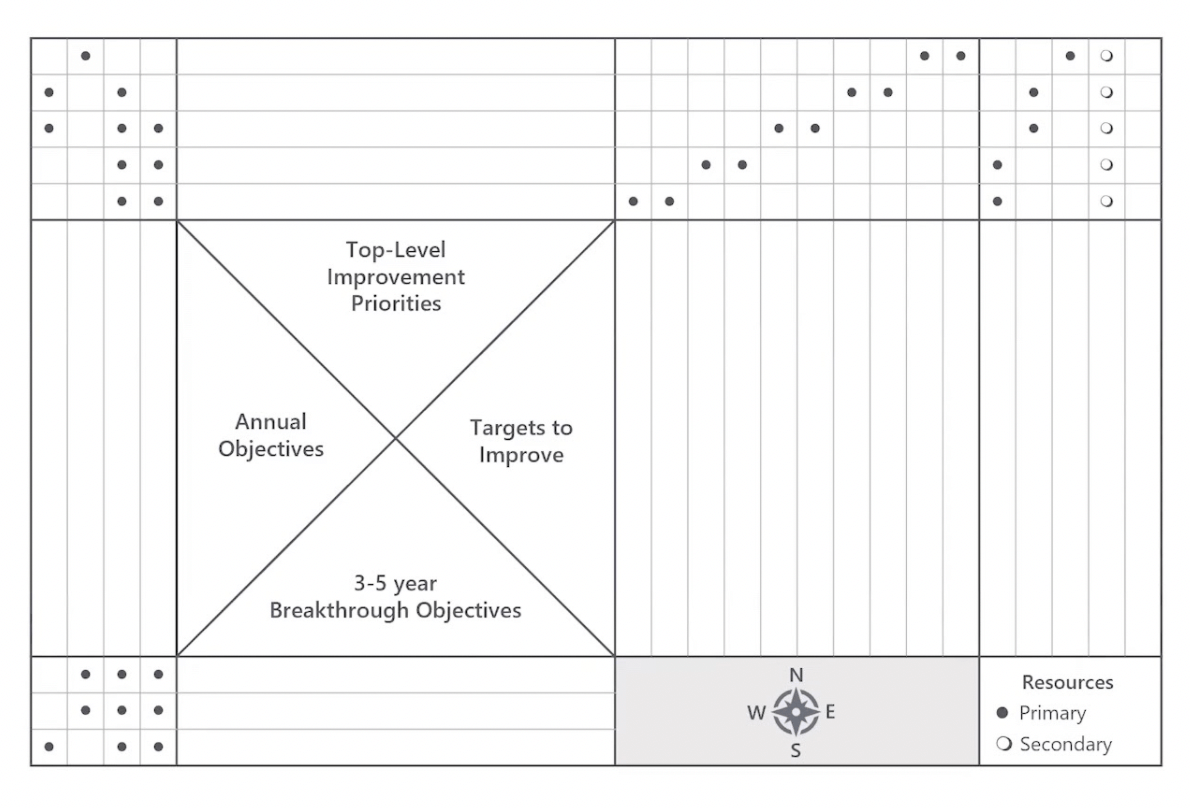
I know it can be overwhelming. I love a good spreadsheet maybe more than anyone and even my head hurt the first time I looked at it. So let's walk through each section to see how to use it and then I'll cover an example showing it all filled out at the end.
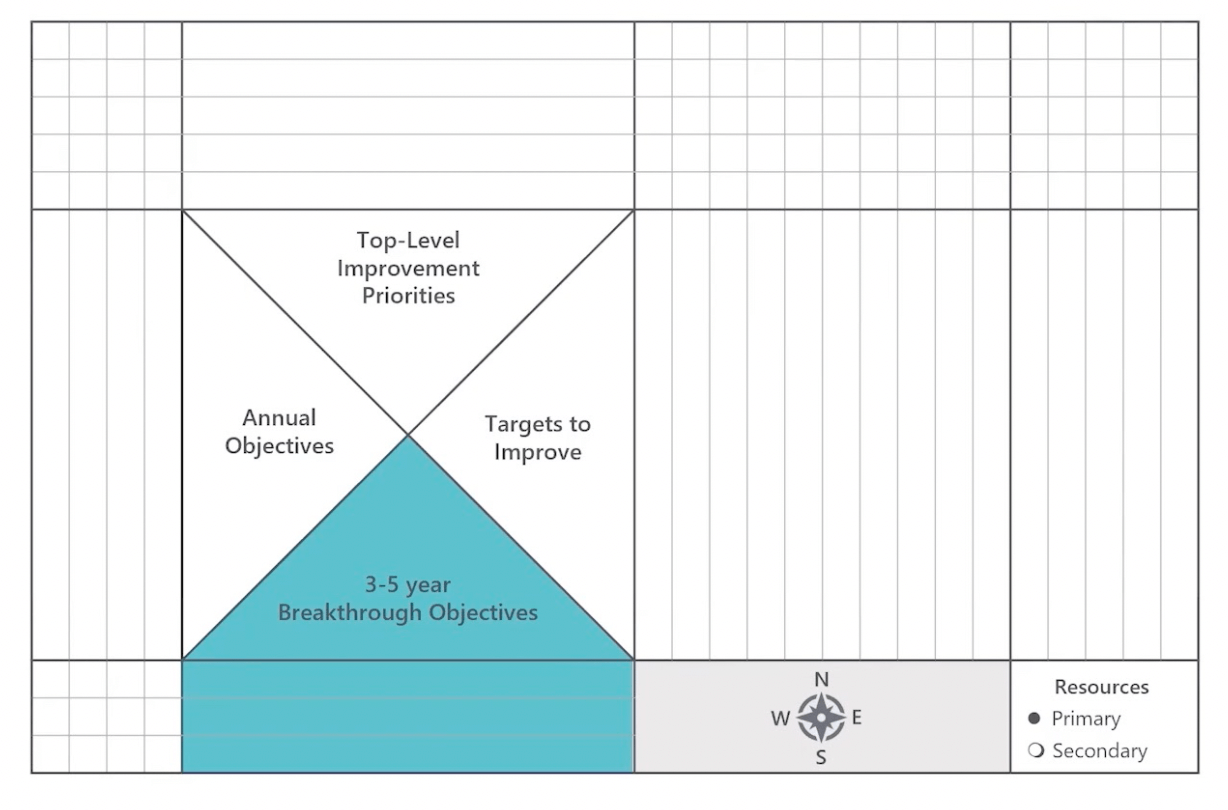
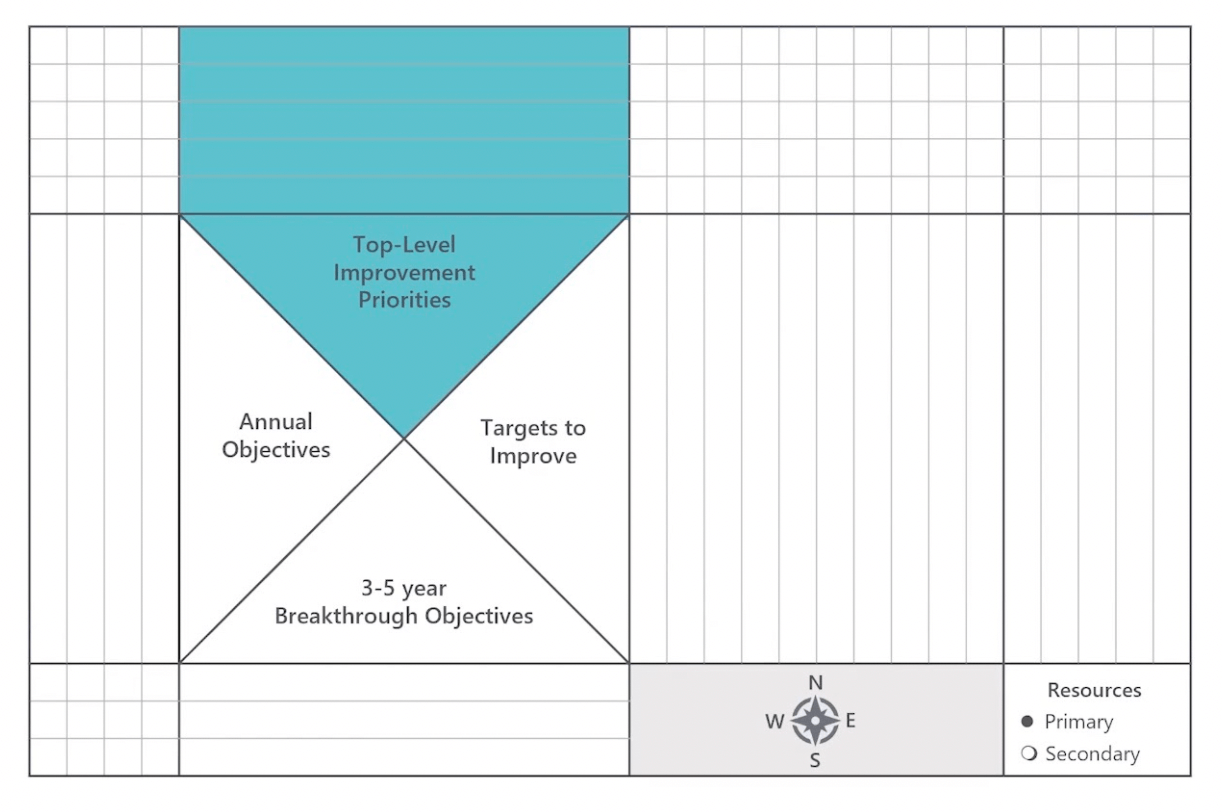
Step 1: What
The first step to follow when using the X-Matrix is to start at the bottom with your three to five-year breakthrough objectives. These are really what your organization needs or wants to achieve in the next three to five years to meet your strategic goals.
They should be measurable stretch goals, just a high-ranking few, three to five max. They should include the voice of all our stakeholders, and they require a multifunctional commitment. Not just product marketing, or even just product, it should be everyone functionally.
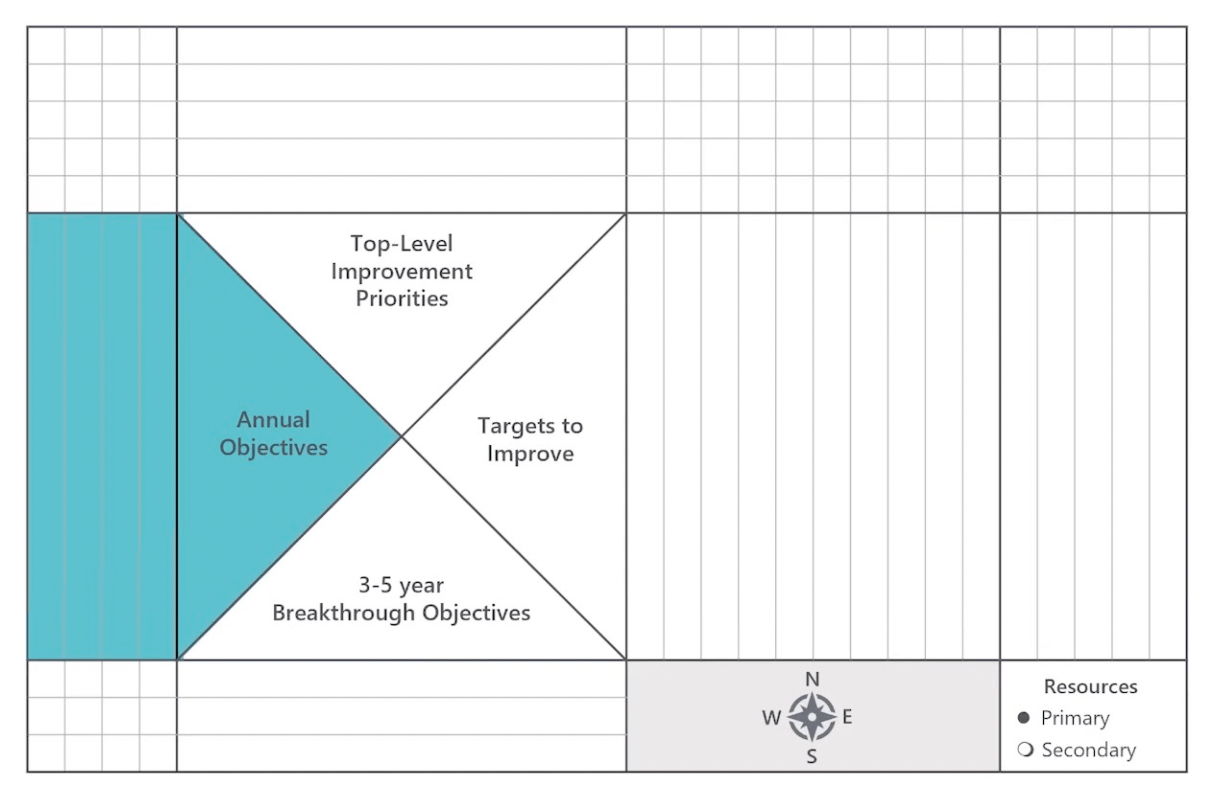
Step 2: How far
Then we move to step number two: your annual objectives. This is how far you want to progress towards your three to five-year breakthrough objectives in this calendar year.
You could target maybe 50%, 30% of where you want to be in three to five years. These should be stretch goals, smart goals, that require multifunctional commitment.
These objectives should be shared or at least aligned with your functional peers in sales, product, and marketing.
Step 3: How
Next, you need to ask yourself: How are you going to achieve those annual objectives? What are the key drivers? These should be easy to communicate, and limited to a high-ranking few.
They may or may not require a multifunctional commitment. For myself and my team, we put our go-to-markets in here that we're responsible for developing and executing on. Those are our priorities for the year, and they will all contribute to our annual objectives.
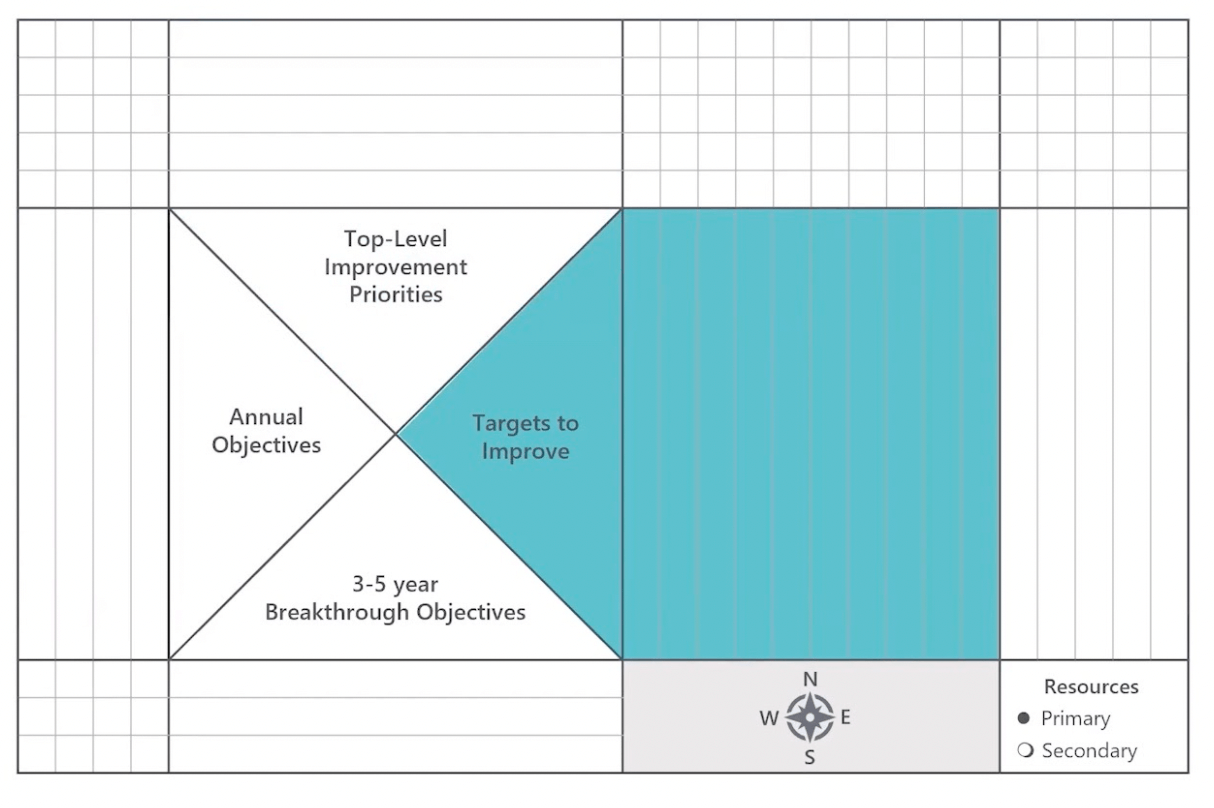
Step 4: How much
This is where the targets to improve are defined, whether it's OKRs or KPIs. They should be very specific targets that are measurable with dates. And they should link back to the annual objectives.
They should show how the top-level improvement priorities will have an impact on the annual objectives. For each improvement priority, there should be a leading indicator and a lagging indicator.
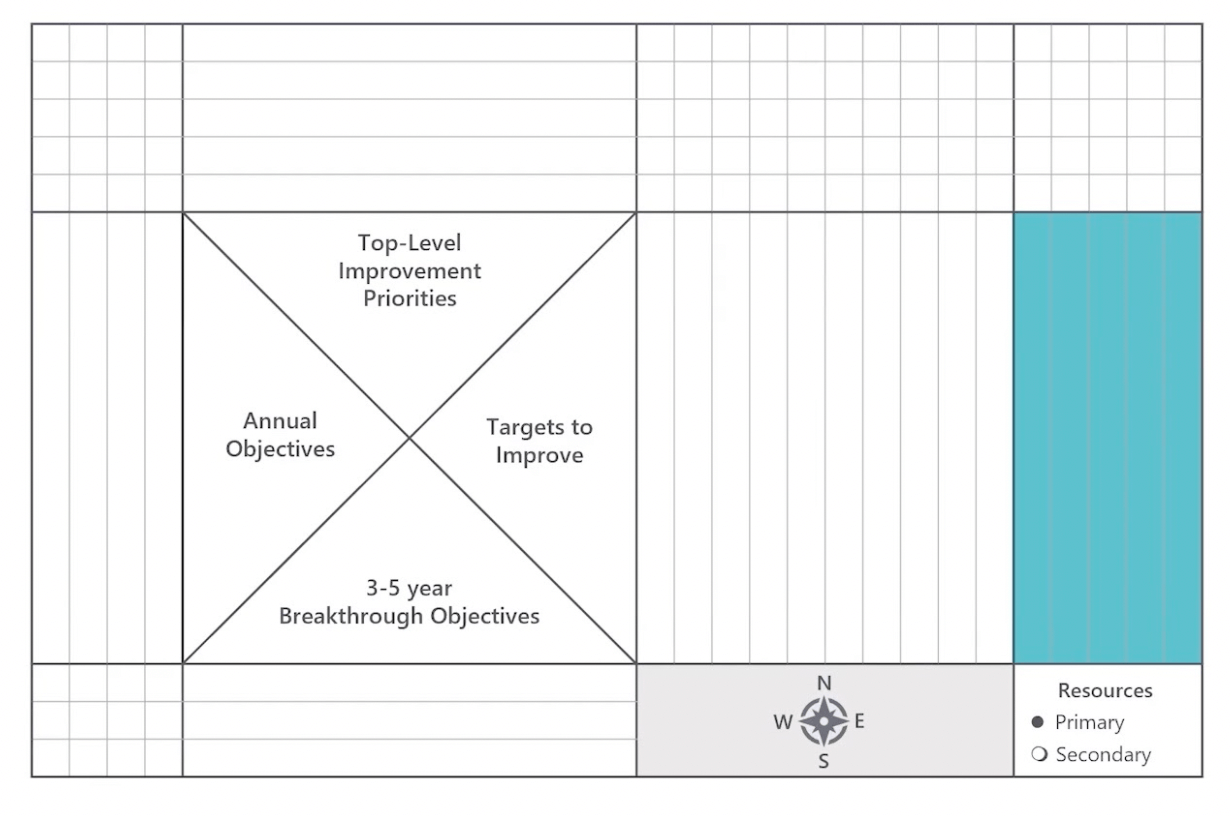
Step 5: Who
Who's responsible? Who owns the plan? Multiple resources can work or own the plan but only one person is the primary responsibility, and they are responsible for the plan.
Step 6: Connect the dots
This is the fun part. This is where the beauty in my opinion of the X-Matrix comes together.
By connecting the dots at the intersections, that physically links your three to five-year strategy to your annual objectives, to your improvement priorities, to your targets to improve, and who owns them.
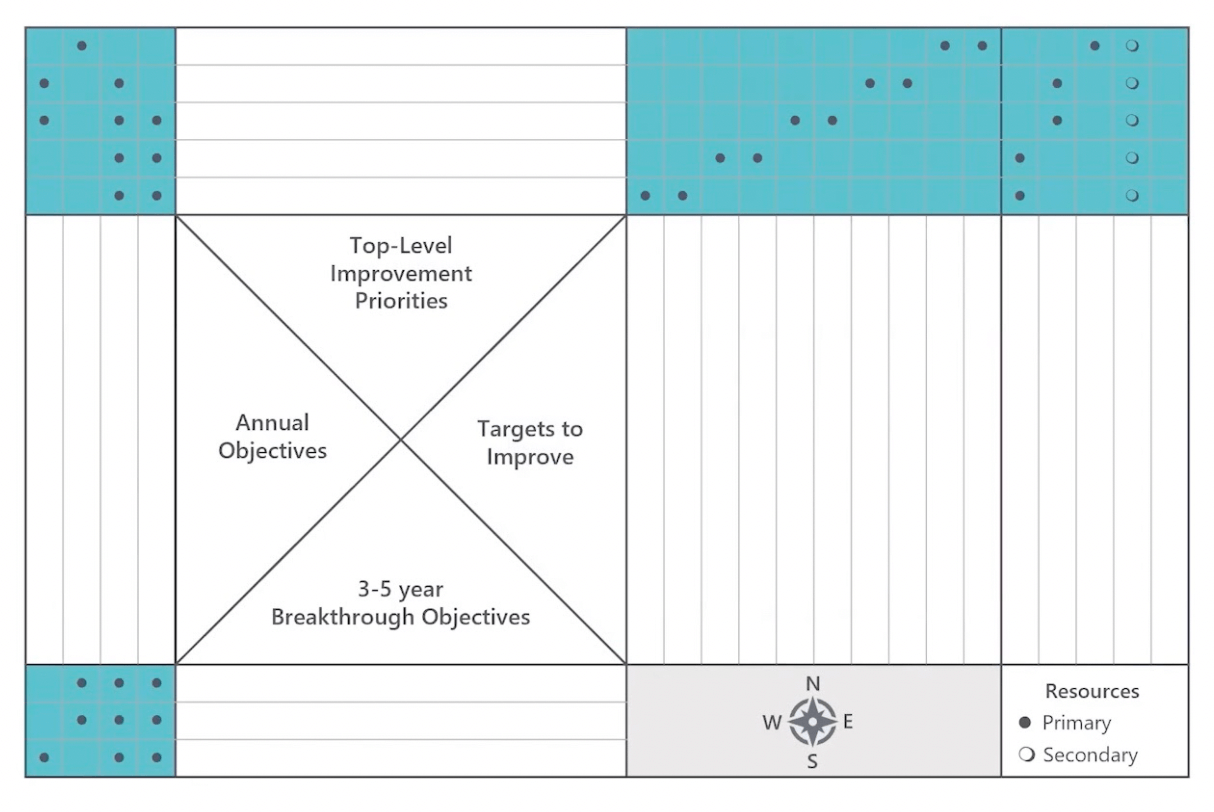
An example
Here's a generic example I put together for a product marketing team. We can walk through it in the same order from the bottom to the right, clockwise.
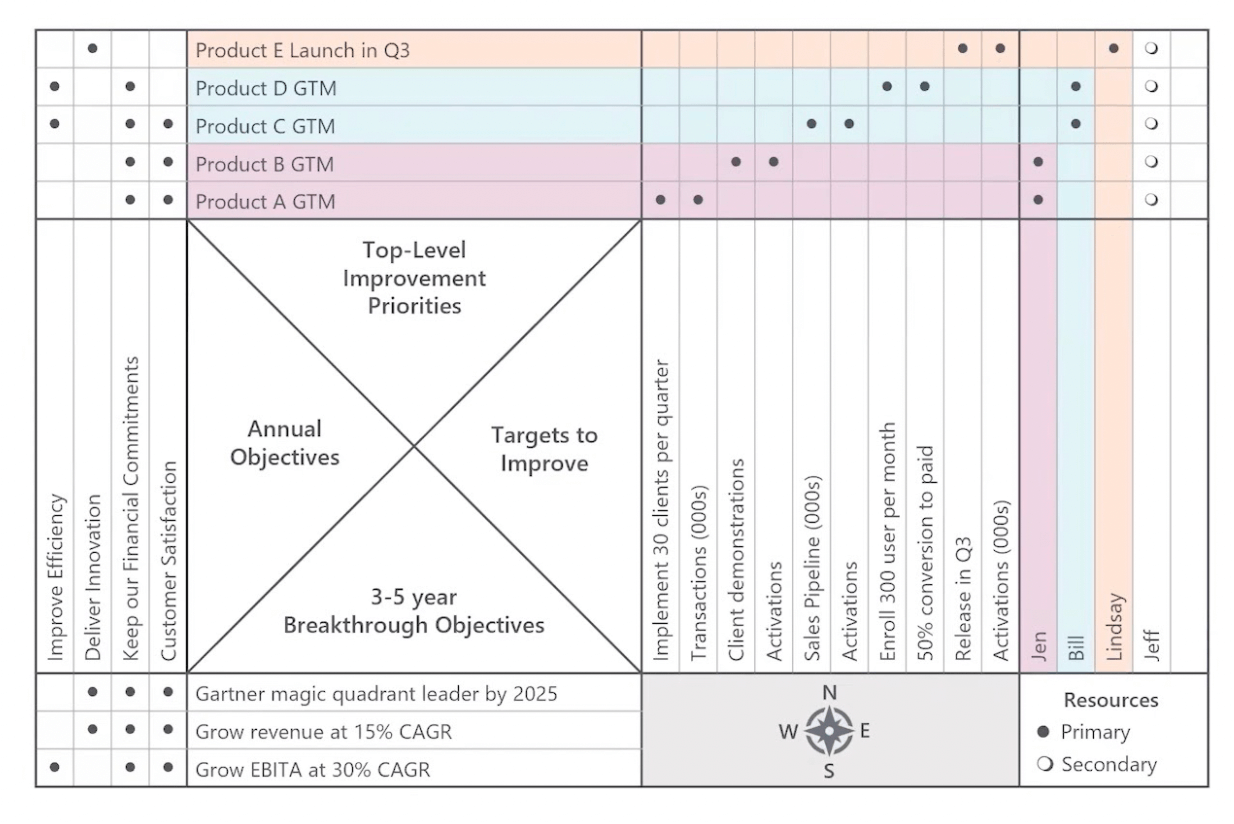
Three to five-year breakthrough objectives: What
Let's say in three to five years we want to be the category leader as recognized by Gartner's Magic Quadrant. We want to grow revenue at 15%, compound annual growth rate, and grow EBITDA at twice that rate at 30%.
Annual objectives: How far
How much of that are we going to achieve this year? What are our annual objectives? Honestly, these ones aren't that good. These ones are not measurable, they're not timely, true SMART goals.
But for a generic example, they fit the bill. So we want to achieve customer satisfaction, maybe measured by NPS score, we want to keep our financial commitments in terms of revenue and profit.
We want to deliver innovation, we want to improve efficiency, maybe in terms of gross margin.
Top-level improvement priorities: How
For product marketing, what are the top-level improvement priorities that will contribute towards these objectives? Here, I put in five go-to markets that are going to be our team's priorities for the year, products A, B, C, D, and E.
Targets to improve: How much
On the right are the targets to improve, these are really hard to read because you have to tilt your head to the side and I'll deal with that when I get to the bowler. The bowler makes that a lot easier to read and monitor.
But what to notice here is that for each go-to-market, there are two targets to improve, one leading indicator, and one lagging indicator.
The team: Who
And then finally, we'll look at the team. We have four people on our team, Jen, Bill, Lindsey, and myself as the manager.
You can easily see Jen owns go-to-market strategies for products A and B. Bill owns go-to-market for products C and D, and Lindsay owns go-to-market launch for product E. Then I'm ultimately accountable as the manager so I'm the secondary resource for all of those.
How does this help show how a strategy connects to action? Let's look at the example of being the category leader in Gartner's Magic Quadrant. If we look at the bottom:
- How does that connect to our annual objectives?
In order to do that, we need to maintain customer satisfaction. We need to keep our financial commitments in terms of sales. And we need to deliver innovation. Those match up pretty well with Gartner's quadrant where they're looking at the vision and ability to execute.
- How is product marketing going to contribute to those objectives?
We're going to execute on our go-to-market for products A, B, C, and D. And E will contribute towards delivering innovation, that's the only one that's on our innovation so that's very important to deliver on.
- What are the actions?
- How are we going to measure ourselves in terms of targets to improve?
Let's just look at product A's go-to-market, we're going to implement 30 clients per quarter and maybe this is a transactional product so we're going to measure the number of transactions being processed on the platform, as well.
That would be our leading indicator would be implementations and our lagging indicator would be transactions. This is a really nice way to look holistically and connect your strategy to your actions.
The benefits of an X-Matrix
Developing an X-Matrix is an iterative process that includes working with stakeholders to set those objectives and priorities. For product marketers who may have an ambiguous role, it's a great way to get clarity and ensure organizational alignment.
Ask yourself: am I being productive? This is a great way to ensure you're being productive because you know your actions are being linked back to the annual objectives, and the three to five-year breakthrough goals.
In the next section, I'll take a closer look at these targets to improve and how to monitor and measure them. I talked about the X-Matrix, now let's jump into the bowling chart.
2. Bowling chart
A bowling chart is a simple visual way to monitor your OKRs, KPIs, or other objectives, and lets you compare your actual metrics to your targets and goals.
It's quickly reviewed on a monthly basis, maybe in a half-hour meeting with stakeholders to ensure that priorities haven't changed, quickly see where there are problems, and work with the team to address them if it's decided to take that course of action.
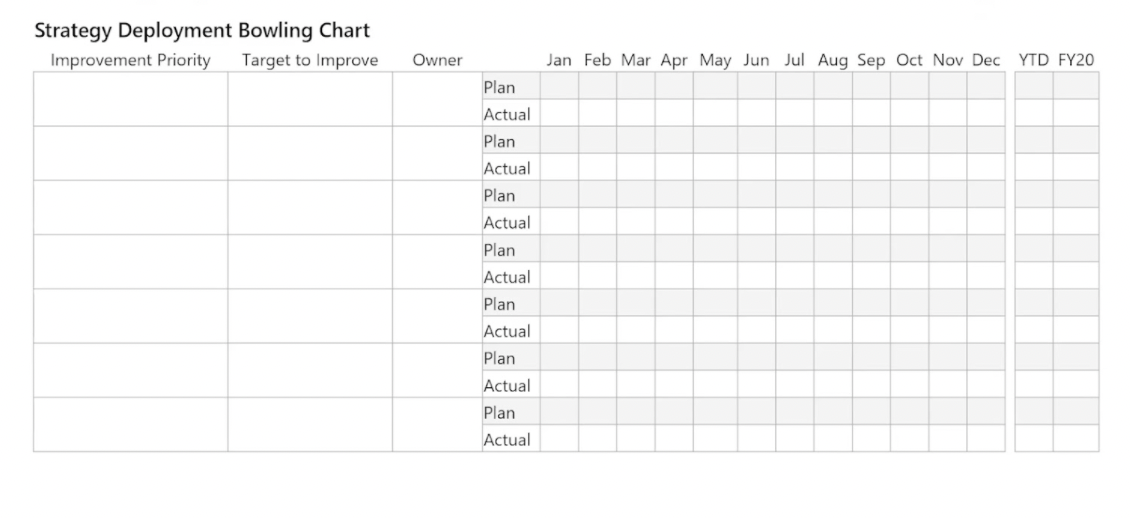
So, how do you use it?
X-Matrix feeds into the bowler
If you've already completed your X-Matrix it's really easy because it all just feeds right into the bowler. Simply transpose the improvement priorities, targets to improve, and owners into the relatively associated columns in the bowling chart.
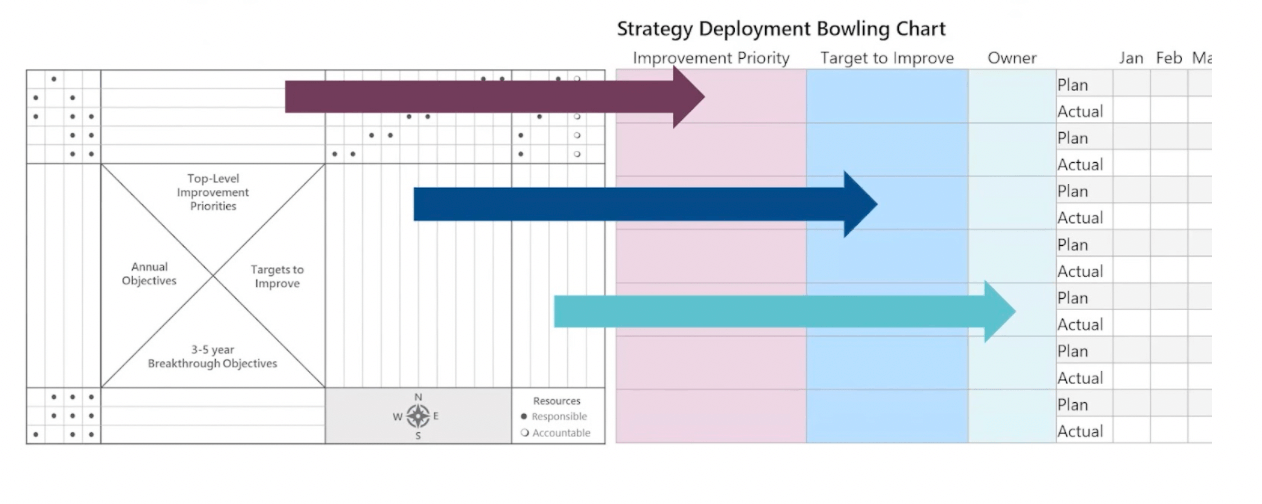
Then, add your planned targets or planned values for each month or quarter or period that you desire. As you measure them throughout the course of the year, record your actual values.
If the actual value meets or exceeds the target, mark it as green. If it falls short, mark it as red, it's that simple.
Example
Here's an example that's based upon the X-Matrix example shown earlier.
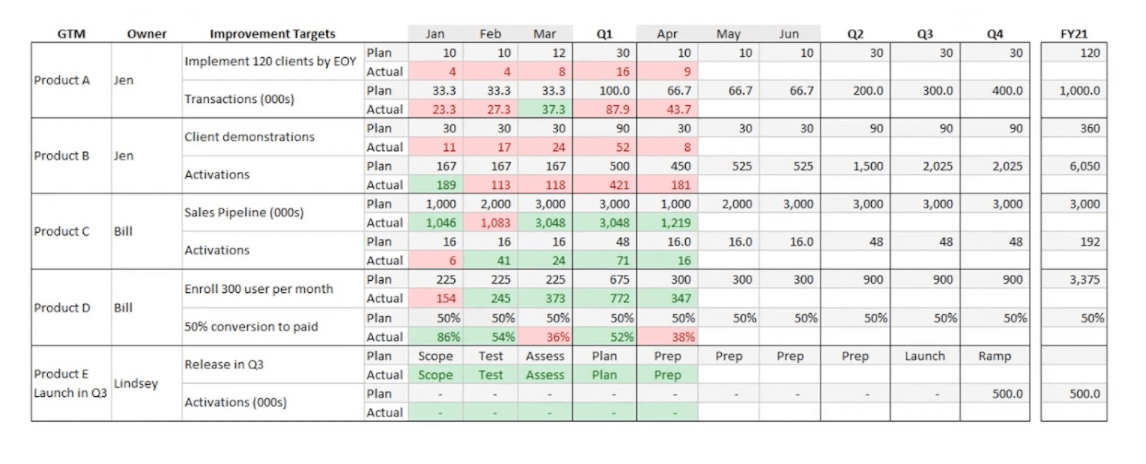
We have our five go-to-markets in the first column, our owners, Gen, Bill, and Lindsey that have primary responsibility for these go-to-markets and it's their responsibility to define the improvement targets, record the plan, and record the actuals throughout the course of the year.
I like to look at it month by month and by quarter because sometimes you have a bad month, but that doesn't make the quarter. And oftentimes there's variability month to month in the quarter that isn't captured in the plan, such as sales closing in the last month of the quarter but the plan is equal across every month in the year.
Why the bowler is helpful
I find this tool helpful in three ways.
Reviews
Number one, when we review with the stakeholders monthly, I always ask "Are these still the priorities that we should be working on?" Almost always, the answer is yes. But it's good to check in because things change.
- Maybe product A is no longer the top priority.
- Maybe we have a new product we've decided to launch in response to a competitor and we need to add that one to the list.
It's a good checkpoint to ask that question.
Quickly identify problems
Number two, you can quickly see where there are some problems by the rows that are marked in red. It's really visual, it jumps out that product A and product B are not meeting the plan and we'll need to take some intervention here to get it back on track.
Identify team imbalance
Number three, you can see where there might be some imbalance in the team. For example, Jen owns both the go-to-markets that have problems right now. Whereas Lindsay owns only one go to market and that's more of a long-term effort where she's planning and preparing for a launch in Q3.
Maybe it might be a stretch for Jen to tackle both of these problems at once. So in this example, as a manager, maybe Lindsay can help out with Jen on one of those go-to-market strategies and understand what the problem is.
This brings us into our next section…
3. Structured problem-solving
How do we find the root cause of these missed targets in the bowler and get them back on track?
Problem-solving methods
There are a lot of structured problem-solving methods, all with clever acronyms. Here's a selection; I'm not going to go through these in detail.
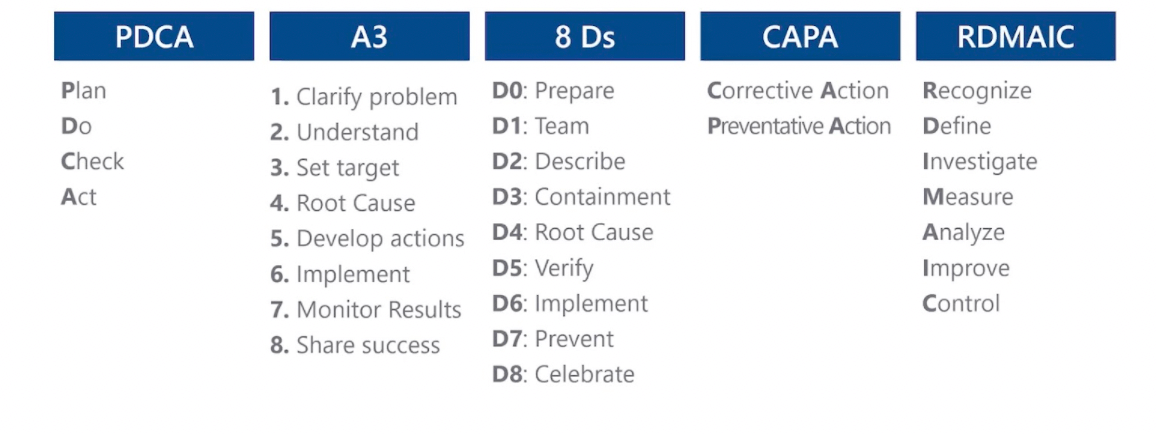
Often it's not necessary to be this rigorous. If you're trying to solve the problem of a failed rocket launch, you're gonna need to use one of these processes and really work the problem with a big team.
But if you're trying to solve the problem of lagging product adoption, just keep it simple and be nimble about it. But do use some structure to organize the effort and record it to make sure everyone's on the same page.
Example
Here's our familiar bowler chart and let's look at product A.
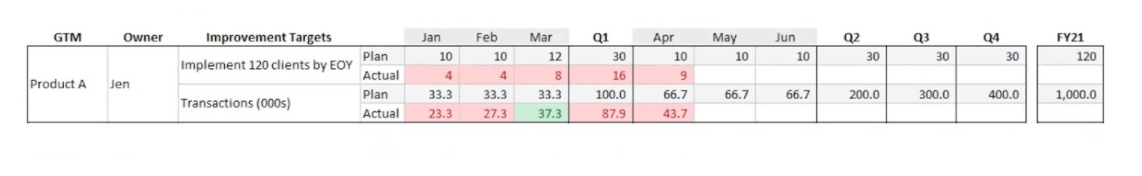
So product A, we are missing the target every month for implementations and we've missed the target on transactions for three of the past four months and for quarter one.
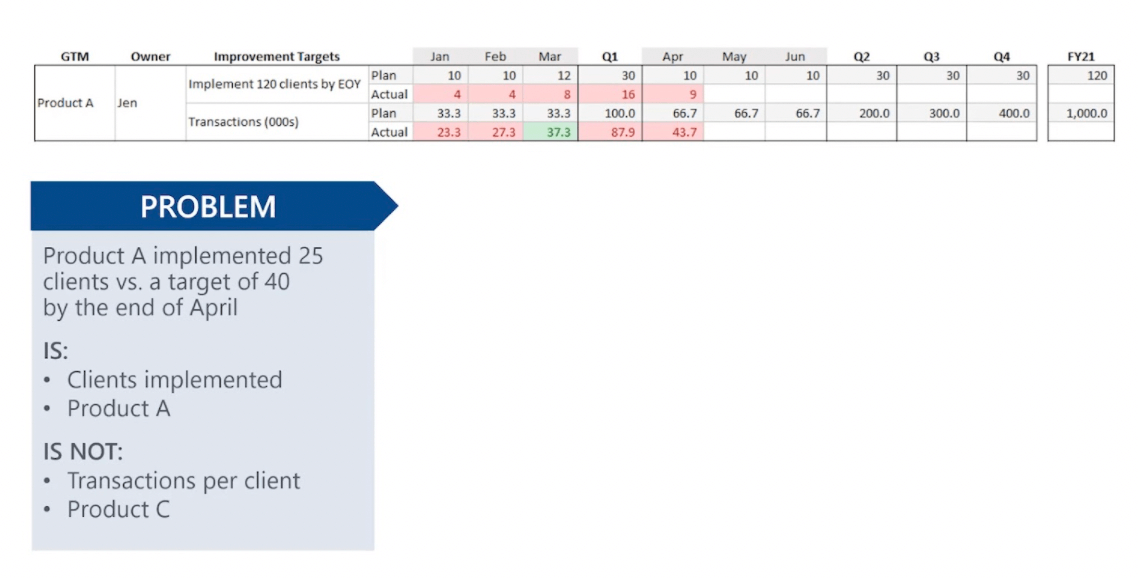
- Let's define the problem
Product A implemented 25 clients versus a target of 40 by the end of April. What I like to do is an ‘is not’ analysis. So what is this problem? This problem is the number of clients implemented. It is on product A.
It's not transactions per client. Because if you look at the data, we actually are almost achieving 90% of our transactions goal in Q1, whereas we barely exceeded half of our implementation goal in Q1.
In terms of clients actually using this product and processing transactions, we're doing better than expected. It looks like it's pretty purely on the implementation goal. This is where it's helpful to have a leading indicator and a lagging indicator.
Ideally, they would be very closely correlated. Here, they are definitely related but we can see that transactions are outperforming our expectations and implementations are, at least on a per-client basis, lagging our expectations.
Perhaps product C is very closely related to product A, maybe customers always buy them together, but we're only seeing the problem on product A; this is good information to know.
2. Understand the root cause
The next step is to understand the root cause. This is a very abbreviated fishbone diagram I like to use where you just keep asking why and listing out the possible reasons why.
On the left-hand side, start there, what's the problem? Product A implementations. Why might implementations be lagging? Could be marketing, could be sales, it could be implementations.
Let's say we checked our marketing funnel, we're outperforming in terms of leads, sales are killing it on bookings. It's pretty clear the root cause resides in implementations.
So why would implementations be so low? Maybe we don't have the staffing to onboard new clients. Maybe the process takes longer than we thought. Maybe the clients are not prepared and don't want to onboard right away.
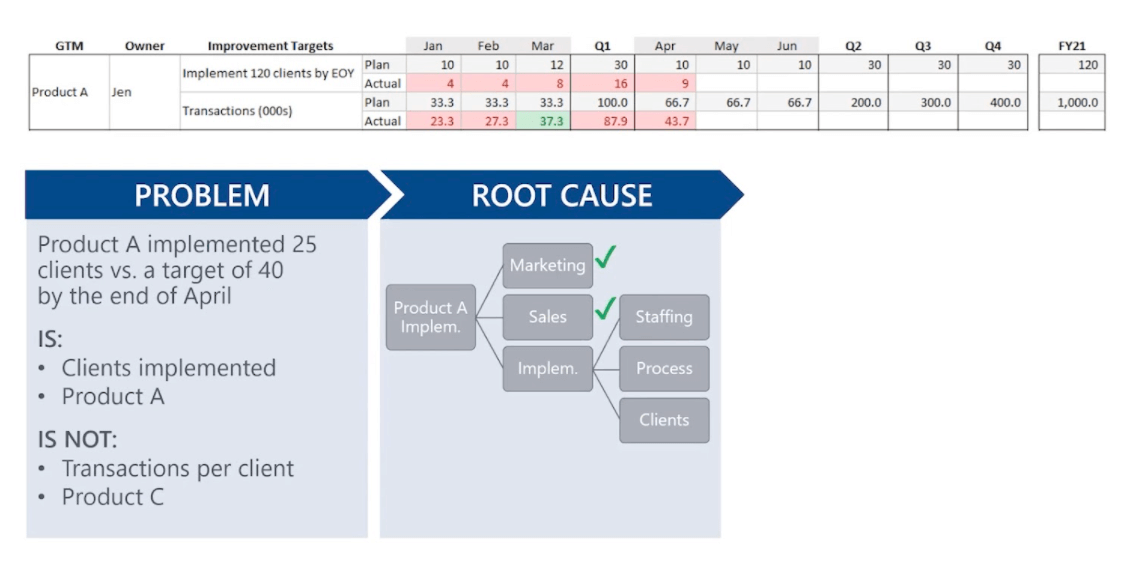
You can continue through that but once you've determined where the root cause most likely lies come up with an action plan.
3. Create an action plan
A simple table like this is really quick to put together but can be very effective.
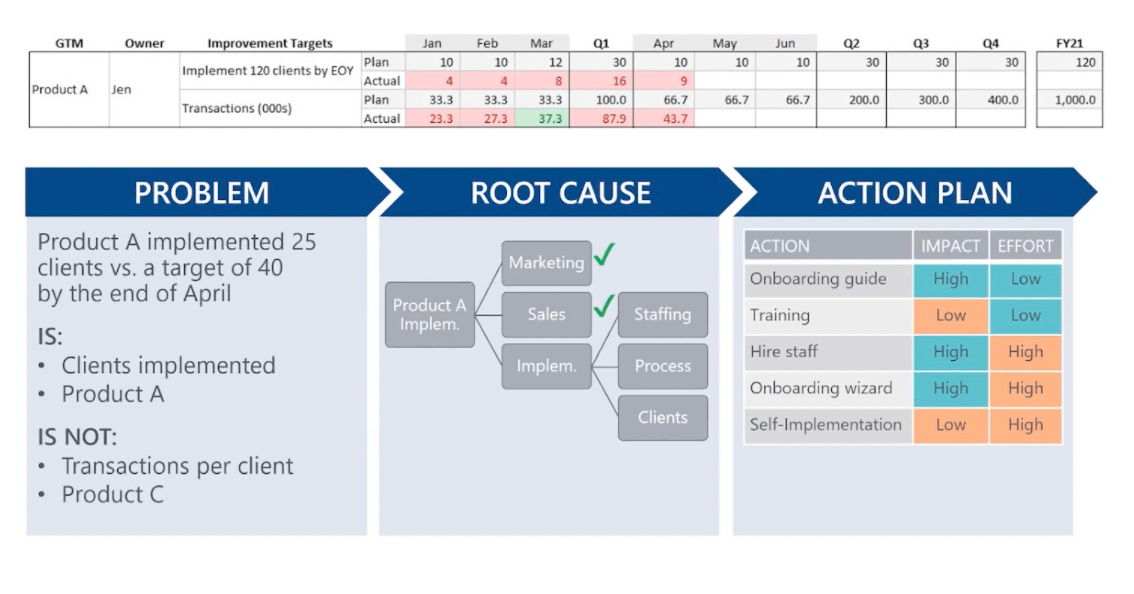
The actions are listed on the left and I like to prioritize them using an impact and effort rubric. Anything that's potentially high impact and low effort do right away. Anything that's low impact and low effort - try to do if you can.
For example, training might only take an hour and might not have much of a difference, but let's just do it. Anything that's high impact and high effort, like developing an onboarding wizard, or potentially hiring new staff in this environment, may need to put that on the roadmap.
Anything that's low impact and high effort, like creating a whole new product that is self-implementing, that you can put below the cut line unless conditions change. But in this case, you've got an action plan that you're pretty certain is going to address the root cause.
Then you can just start working the plan and keep tracking the bowler and see if the metric turns from green to red over the coming months.
I've talked about the three tools I've used to gain efficiency in product marketing:
- The X-Matrix,
- The bowling chart, and
- Structured problem-solving.
Now, let me share with you the key to success.
The key to success
Balance planning and acting
I've worked in some organizations where it felt like more resources were dedicated to planning and controls than to shipping products.
The process isn’t the product
I really liked this quote from James Clear from his 3-2-1 Thursday newsletter a few weeks ago. If you don't subscribe, I highly recommend subscribing to it:
“Planning and preparation are useful until they become a form of procrastination. Is this task enhancing my actions, or substituting for them?”
James Clear, 3-2-1 Thursday newsletter
It says planning and preparation are useful until they become a form of procrastination. Is this task enhancing my actions or substituting for them?
That's a great litmus test for any of these processes and tools.
But on the other hand, some of you may be saying "We don't need all these processes and tools for planning. We're agile". I love agile practices, but agile recognizes balance as well.
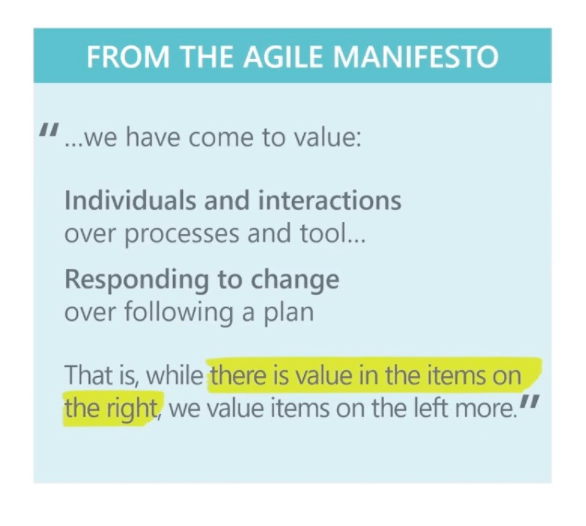
The agile manifesto
Even if you look at the Agile Manifesto, it says they value individuals and interactions more than processes and tools, and they value responding to change more than following a plan.
However, they recognize that there's value to all of those items, and it's about finding balance.
So, to be successful in using these tools in your organization, you need to find the right balance for your team, for your organization, for your products, and for your market.
Because everything is going to be very different from situation to situation.
Thank you.
How to improve your Go-to-Market strategy
Our Go-to-Market Certified: Masters course will give you all the information and knowledge you need to up your GTM game.
Delivered by Yoni Solomon, Chief Marketing Officer at Uptime.com, this course provides you with everything you need to design, launch, and measure an impactful Go-to-Market strategy.
By the end of this course, you'll be able to confidently:
🚀 Grasp a proven product launch formula that’s equal parts comprehensive, repeatable, creative, and collaborative.
🧠 Gain the expertise and know-how to build and tailor an ideal product blueprint of your own.
🛠 Equip yourself with templates to facilitate a seamless GTM process.